The Practical and Powerful PLECS Scope
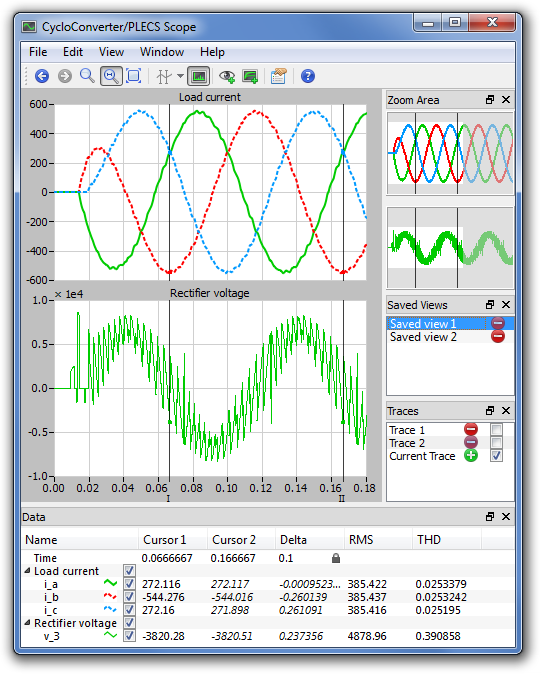
The PLECS Scope is a convenient tool for viewing and processing simulation results. It is also used to easily customize data for reporting purposes. The PLECS Scope can be placed in a Simulink model or in a PLECS schematic. The scope contains a plot area and optional windows for data in table form, the current zoom area, saved views, and saved simulation traces.
Zoom and Pan
Zoom in on a curve by dragging the mouse until the desired area is selected or pan the view by dragging the plot axes. The Zoom Area window shows the portion of the data being currently viewed. It is easy to navigate through the view history or add the current axis settings to a list of saved views to be restored later. Multiple traces can be overlaid and stored to a file to be reloaded in later sessions.
Data Cursors
The cursors allow the user to read exact waveform values or to measure differences between two data points. Besides showing the values and differences, the Data window lets the user easily perform analyses such as the RMS value or THD of the curves between the cursors.
Reporting Results
The user can customize the curve properties such as color and line style by defining palettes or directly editing individual curves. Print the current view directly from the scope or export it to a bitmap or PDF file to include it in a report.
Fourier Analysis
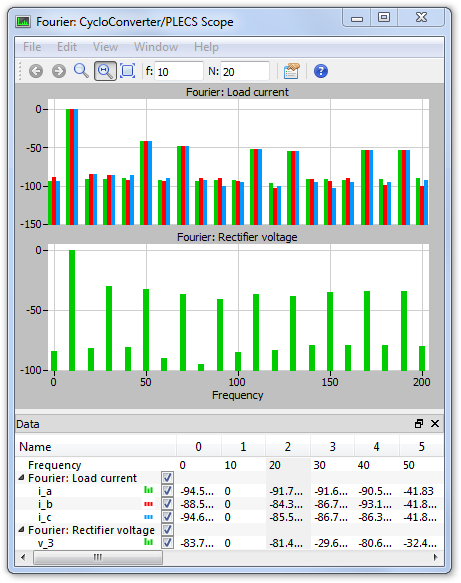
At the push of a button, users can display the Fourier spectrum of waveforms in a separate window. The analysis range is determined by the cursor positions in the scope window.